Introduction
Capturing and querying Amazon EKS and Kubernetes (K8s) cluster traffic is an important skill to possess. It is especially useful during incident-response and when troubleshooting networking issues surrounding nodes, pods, or services in your cluster. Amazon makes it easier to perform capture and query tasks with Amazon VPC Flow Logs and Amazon Athena.
Administrators can use Amazon VPC Flow Logs to capture detailed information about the IP traffic flowing through their VPC, and store it in S3. Once captured in S3, administrators can then use Amazon Athena to query against this data using a familiar SQL interface.
During incident response, Amazon VPC Flow Logs can be used as an auxiliary tool to help dig deeper into the findings reported by your security monitoring systems. In the case of a misconfigured security group or network access control list (NACL), flow logs can speed up the troubleshooting process by helping to pinpoint where the denial is occurring.
Solution overview
In this blog post, I discuss how to query various types of K8s-based traffic using Flow Logs, Amazon S3, and Athena. The following illustrates the infrastructure required to perform the steps in this blog post:


This blog post is intended for those who maintain or administer applications on a K8s cluster running on Amazon EKS or native K8s on EC2 with the AWS Networking CNI plugin. Even if you don’t maintain or administer a K8s cluster, this post exposes you to some valuable network troubleshooting tricks.
Prerequisites
To follow along on your own with the steps in this blog, if not already deployed, the following prerequisites are needed:
An AWS account with a running K8s cluster
You need at least a two-node K8s cluster deployed into your VPC. The implementation can either be K8s on Amazon Elastic Compute Cloud (Amazon EC2), or an Amazon EKS cluster. Either way, you must be running the Amazon VPC CNI. The website eksworkshop.com has a great tutorial for getting up and running quickly with an account, as well as an EKS cluster.
S3
You use an S3 bucket destination for your flow logs data. Reference the Amazon S3 docs for assistance in creating the bucket. NOTE: There is no need for public access to this bucket, so do not grant it.
Handy links:
Amazon VPC Flow Logs enabled on your K8s cluster’s VPC
Amazon VPC Flow Logs is a feature that enables you to capture information about the IP traffic going to and from network interfaces in your K8s cluster’s VPC. You use the data retrieved by flow logs to gain insight into your K8s cluster communications.
Details on how to enable flow logs can be found on the publishing Flow Logs to Amazon S3 page. From there, follow the directions under the “To create a flow log for a VPC or a subnet using the console” section. When you get to the step that selects a filter, choose All. For Format, choose Custom, and select all fields as documented in VPC Flow Logs Available Fields page in the same order, from top-down.
Amazon Athena
Amazon Athena makes it easy to analyze data in Amazon S3 using standard SQL. Follow the directions in the Athena User Guide to copy and paste the data definition statement (DDL), create the table, create the partition, and run the first sample query.
NOTE: You are not able to retrieve data for dates that have not been partitioned, so partition for each day manually, or via an AWS Lambda function.
The default partitioning in the above referenced DDL is adequate for a short-lived test environment. For production environments, be sure to follow the top 10 performance tuning tips for Amazon Athena to optimize performance and cost.
NOTE: There can be a variable delay from when flow logs are collected and traffic data is delivered to S3 for access by Athena. If you don’t see flow logs or Athena results as expected, try again in ten-minute intervals.
Kubernetes networking patterns
Within a Kubernetes (K8s) cluster, network communications occur across different address spaces and objects. In this blog post, we show you how to query for the most common flows in K8s, which include:
- Pod to Pod
- Pod to ClusterIP
- Node to Pod
- Node to ClusterIP
- Load balancer / NodePort
What you see is in the I(P) of the beholder
Flow logs captures network traffic via the ENIs connected to a node. Since there are ENIs running on both the sending and receiving nodes, for each traffic event, there are two “perspectives” of it. For each of the networking patterns, I demonstrate how to use a WHERE clause to view the perspective of your choice.
It’s also important to note that requests to a pod made from the same node the pod lives on are handled by the node’s virtual Ethernet bridge. Requests handled by this bridge never reach the wire, and as such, flow logs never captures these requests.
This is especially important to keep in mind when analyzing pod to ClusterIP flows, where the client has no control over which pod endpoint will be serviced by the ClusterIP request.
Two different source and destination addresses
The queries I demonstrate in this blog post references the pkt-srcaddr, pkt-dstaddr, srcaddr, dstaddr flow logs fields. Fields prefixed with “pkt“ represent the source and destination address found on the actual IP packet. Source and destination fields without a ”pkt“ prefix represent the address of the interface the packet is sent from or received on. This makes more sense as I demonstrate some examples, but for more details on these fields, refer to the flow logs documentation.
With that, let’s jump in to some examples!
Querying pod to pod flows
Pods are the smallest deployable unit of compute that can be created and managed in K8s. Pods may communicate directly with each other using their own unique IP addresses, most commonly in a StatefulSet use case, as illustrated below:

To generate traffic for this example, I exec’ed into my busybox pod running on Node A, and issued an HTTP request against an NGINX pod running on Node B.
Querying for the event
When pods on different nodes communicate directly with each other, flow logs capture two perspectives of the event, one from each nodes’ ENI. The below table illustrates what each ENI in the communication captures, based on whether it’s the client, or server:
| sourceaddress | packetsourceaddress | destinationaddress | packetdestinationaddress | |||
| sender (client) sees | Client Node IP | Client Pod IP | Server Pod IP | Server Pod IP | ||
| receiver (server) sees | Client Pod IP | Client Pod IP | Server Node IP | Server Pod IP |
WHERE clause truth table for pod to pod traffic.
Based on the above table, you can craft our WHERE clause to query based on the client or server perspective.
To view the event from the perspective of the client, our WHERE clause would look similar to:
WHERE sourceaddress = 'CLIENT_NODE_IP' AND packetsourceaddress = 'CLIENT_POD_IP' AND
destinationaddress = 'SERVER_POD_IP' AND packetdestinationaddress = 'SERVER_POD_IP'
To view the event from the perspective of the server, our WHERE clause would look similar to:
WHERE sourceaddress = 'CLIENT_POD_IP' AND packetsourceaddress = 'CLIENT_POD_IP' AND
destinationaddress = 'SERVER_NODE_IP' AND packetdestinationaddress = 'SERVER_POD_IP'
In addition, add the port that the “server“ pod is listening on (destinationport) to filter by the actual service.
As an example, I performed my Athena query from the client’s perspective, using the following SQL:
SELECT date_format(from_unixtime(starttime, -8, 0),'%Y-%m-%d %H:%i:%s') AS approx_time, interfaceid, sourceaddress, packetsourceaddress, destinationaddress, packetdestinationaddress, destinationport
FROM vpc_flow_logs
WHERE sourceaddress = 'CLIENT_NODE_IP' AND
packetsourceaddress = 'CLIENT_POD_IP' AND
destinationaddress = 'SERVER_POD_IP' AND
packetdestinationaddress = 'SERVER_POD_IP'
AND destinationport = 8080
LIMIT 100
That query resulted in the following output:


Querying Pod to ClusterIP Flows
Pods may exchange data with a backend K8s ClusterIP service to in order to perform their duties. For example, a pod serving a login service request may report the login event to a security ClusterIP service, as illustrated below: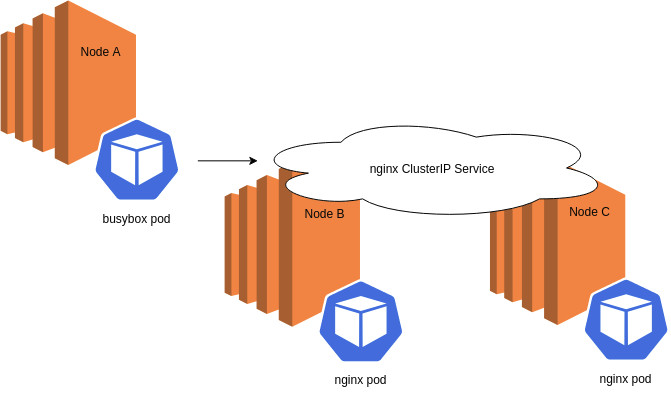
Pod Z communicating with ClusterIP Service X.
To generate traffic for this example, I made a few requests from my busybox pod to my NGINX ClusterIP service, which distributes requests across all three NGINX pods in my cluster.
Querying for the event
Requests to a ClusterIP service’s IP:port pair never reaches the wire. When requests to ClusterIPs are made, they are intercepted and NAT’ed (by iptables) to a pod that serves as that ClusterIP’s service endpoint, as illustrated below: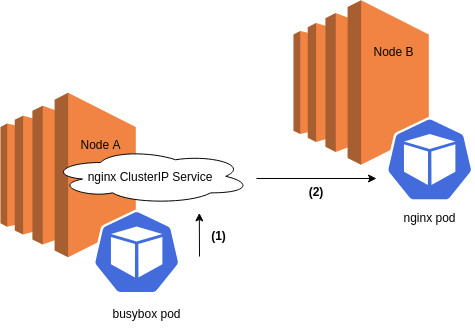
(1) A busybox pod makes a request to a ClusterIP service with source IP of BUSYBOX_POD, destination IP of CLUSTERIP. (2) The ClusterIP request is intercepted and NAT’ed by iptables running on the node to a pod endpoint, hitting the wire with source IP of BUSYBOX_POD, and destination IP of NGINX_POD.
To elaborate on that point, the original request from the busybox pod to the ClusterIP resembles this:
| Source | Destination |
| BUSYBOX_POD_IP via NODE_A_IP | CLUSTERIP_IP:CLUSTERIP_PORT |
And the request that ends up hitting the wire after iptables NAT’ing changes make it look like this:
| Source | Destination |
| BUSYBOX_POD_IP via NODE_A_IP | NGINX_POD_IP:NGINX_PORT |
Taking a closer look at that address signature, you can see that this traffic is now indiscernible from pod to pod traffic.
The takeaway is that, from a flow logs perspective, pod to pod, and pod to ClusterIP traffic appear as pod to pod traffic — and you query both of them in the same manner.
| sourceaddress | packetsourceaddress | destinationaddress | packetdestinationaddress | |||
| sender (client) sees | Client Node IP | Client Pod IP | Server Pod IP | Server Pod IP | ||
| receiver (server) sees | Client Pod IP | Client Pod IP | Server Node IP | Server Pod IP |
WHERE clause truth table for pod to pod (and pod to ClusterIP) traffic.
Refer to the previous section, querying Pod to Pod Flows<link> for example queries that can be used as well for pod to ClusterIP traffic.
Querying Node to Pod Flows
Capturing node to pod traffic comes in handy when troubleshooting pod health check issues, or verifying connectivity from an application running on a node to a StatefulSet or service.
To generate traffic for this example, I SSH’ed into a node in my cluster, and issued an HTTP request to an NGINX pod running on a different node, as illustrated below:

Querying for the event
During node to pod communication (where the destination pod exists on a remote node), flow logs captures two perspectives of the event, one from each nodes’ ENI. The below table illustrates what each participant in the communication sees, based on whether it’s the node (client), or the pod (server):
| sourceaddress | packetsourceaddress | destinationaddress | packetdestinationaddress | |||
| sender (client) sees | Client Node IP | Client Node IP | Server Pod IP | Server Pod IP | ||
| receiver (server) sees | Client Node IP | Client Node IP | Server Node IP | Server Pod IP |
WHERE clause truth table for node to pod traffic.
Based on the above table, you can craft our WHERE clause to query for the traffic from the client’s perspective, or the server’s perspective.
To view the event from the perspective of the client, our WHERE clause would look similar to:
WHERE sourceaddress = 'CLIENT_NODE_IP' AND
packetsourceaddress = 'CLIENT_NODE_IP' AND
destinationaddress = 'SERVER_POD_IP' AND
packetdestinationaddress = 'SERVER_POD_IP'
To view the event from the perspective of the server, our WHERE clause would look similar to:
WHERE sourceaddress = 'CLIENT_NODE_IP' AND
packetsourceaddress = 'CLIENT_NODE_IP' AND
destinationaddress = 'SERVER_NODE_IP' AND
packetdestinationaddress = 'SERVER_POD_IP'
In addition, you can add the port that the pod is listening on (destinationport) for even more granular results.
As an example, I performed my Athena query from the client’s perspective, using the following SQL:
SELECT date_format(from_unixtime(starttime, -8, 0),'%Y-%m-%d %H:%i:%s')
AS approx_time, interfaceid, sourceaddress, packetsourceaddress, destinationaddress, packetdestinationaddress, destinationport
FROM vpc_flow_logs
WHERE sourceaddress = 'CLIENT_NODE_IP' AND packetsourceaddress = 'CLIENT_NODE_IP' AND
destinationaddress = 'SERVER_POD_IP' AND packetdestinationaddress = 'SERVER_POD_IP' AND destinationport = 8080
LIMIT 100
That query resulted in the following output:

Querying Node to ClusterIP flows
Capturing traffic from a node to a ClusterIP may come in handy, especially when verifying ClusterIP service connectivity from a node, as illustrated below:

To generate traffic for this example, I SSH’ed into a node in my cluster, and issued an HTTP request to my NGINX ClusterIP service.
Querying for the event
As mentioned in the Querying Pod to ClusterIP Flows section, requests to a ClusterIP service’s IP:port pair never hit the wire. When requests to ClusterIPs are made, they are intercepted and NAT’ed (by iptables) to a pod that serves as that ClusterIP’s service endpoint.
To elaborate on that point, the original request from the node to the ClusterIP resembles this:
| Source | Destination |
| NODE_IP | CLUSTERIP_IP:CLUSTERIP_PORT |
And the request that ends up hitting the wire after iptables NAT’ing changes make it look like this:
| Source | Destination |
| NODE_IP | NGINX_POD_IP:NGINX_PORT |
Taking a closer look at that address signature, you can see that this traffic is now indiscernible from node to pod traffic.
The takeaway here is that from a flow logs perspective, node to pod, and node to ClusterIP traffic will both appear as node to pod traffic, and you may query for both of them in the same manner.
Refer to the previous section, Querying Node to Pod Flows<link> for example queries that can be used as well for pod to ClusterIP traffic.
Querying LoadBalancer and NodePort Flows
Analyzing LoadBalancer and NodePort type traffic comes in handy when you wish to observe traffic from the LoadBalancer through to the pod serving the request, as illustrated below: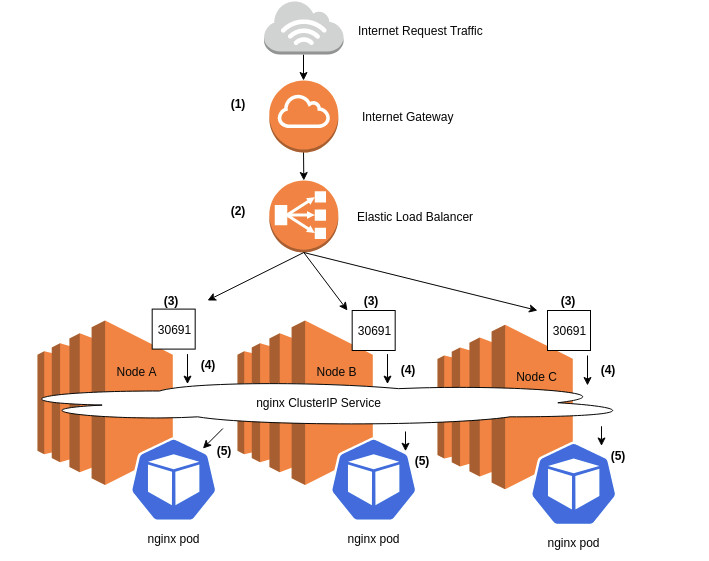
Internet request traffic from the Internet Gateway (1) destined for an Elastic Load Balancer (ELB) (2) is spread across all nodes in the cluster on the NodePort’s listening port of 30691 (3). All NodePort traffic is forwarded to the NGINX ClusterIP Service (4), which then gets distributed to pods which back that service, in our example, Pods A, B, and C (5).
To generate traffic for this example, I exposed my NGINX deployment as LoadBalancer service, and then hit the endpoint on my browser.
NOTE: After exposing the service, I described it to retrieve the NodePort value.
Differentiating between generic NodePort and LoadBalancer sourced traffic
Both NodePort and LoadBalancer (ELB) based traffic are received via a NodePort service. The only way to differentiate between the two of them is to note the source of the traffic:
- When the source of the traffic is your K8s LoadBalancer Service’s ELB IP address, the traffic originated from the ELB.
- When the source is NOT an ELB IP address, the traffic may have originated from any IP address allowable by the node’s security group.
NOTE: The k8s LoadBalancer services use a Classic Load Balancer, which unlike a Network Load Balancer, does not preserve the client IP address.
To quickly identify traffic that originates from the ELB that fronts the LoadBalancer service, you need to create a WHERE clause in Athena that limits the source IP to that of the ELB. But first, you must retrieve the ELB source IPs in order to create that Athena query (replace NGINX_LB_SERVICE_NAME with the name of your k8s LoadBalancer service):
# get the ELB name
NGINX_EXT_ELB_NAME=`kubectl get svc/NGINX_LB_SERVICE_NAME -ojsonpath='{.status.loadBalancer.ingress[0].hostname}' | awk -F - '{ print $1 }'`
#
# get the ELB IPs by cross referencing the names
aws ec2 describe-network-interfaces --filters Name=description,Values="ELB ${NGINX_EXT_ELB_NAME}"  --query 'NetworkInterfaces[*].PrivateIpAddresses[*].PrivateIpAddress' --output table
The IPs returned are the source ELB IP addresses — if you see traffic coming from these source addresses you know it’s from the ELB (K8s LoadBalancer service.)
Querying HTTP traffic generated from your browser to the NGINX loadbalancer service
If you simply query against all traffic destined for service NodePort , you see both direct NodePort, and LoadBalancer traffic:
SELECT date_format(from_unixtime(starttime, -8, 0),'%Y-%m-%d %H:%i:%s') AS approx_time, interfaceid, sourceaddress, packetsourceaddress, destinationaddress, packetdestinationaddress, destinationport
FROM vpc_flow_logs
WHERE destinationport = NODEPORT_VALUE
LIMIT 100
That query resulted in the following output:

Narrowing down the NodePort traffic’s origin
By adding a WHERE clause that limits traffic by the ELB’s source IPs, you can query only for LoadBalancer traffic, eliminating any requests made directly to the NodePort internally or externally:
…
WHERE dstport = NODEPORT_VALUE AND (srcaddr = 'ELB_IP_1' OR srcaddr = 'ELB_IP_2' OR srcaddr = 'ELB_IP_3')…
And by adding a NOT operator, I can find requests made directly to the NodePort outside of the ELB:
…
WHERE dstport = NODEPORT_VALUE AND NOT (srcaddr = 'ELB_IP_1' OR srcaddr = 'ELB_IP_2' OR srcaddr = 'ELB_IP_3')…
Cleanup
Cleaning up helps keep things tidy, and also prevents additional costs from accruing.
When you are done with the tutorial and no longer need the data, delete the:
- Flow log instance from the AWS VPC console page.
- S3 flow logs destination bucket (and all files within it).
- Athena vpc_flow_logs table.
- NGINX deployment within EKS.
- busybox pod within EKS.
- EKS cluster and all accompanying instances and EBS volumes.