The Use Case
In our demo lab, we have a live demonstration using a simple, two-tier application. This application is an e-commerce shopping cart deployed from vRealize Automation and monitored by vRealize Operations (and Log Insight and vRealize Network Insight). Here is the application topology as viewed in Service Broker:
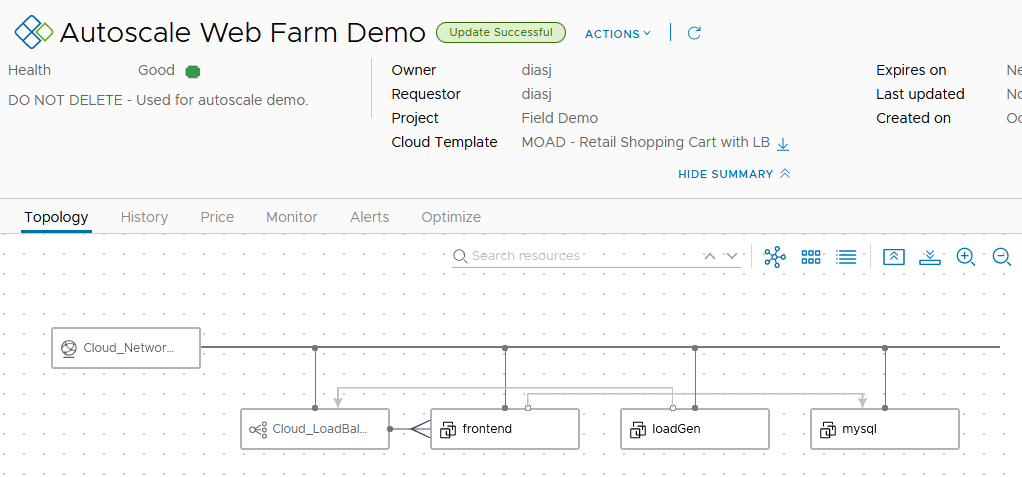
The web tier can scale in and out, using vRealize Automation, via user-initiated action. This way the web tier can be scaled out to meet more demand and scaled in when demand is lower to keep cost down.
My idea is to use vRealize Operations to monitor the load on the web tier and kick off the automation to scale the tier in or out, by adding or removing web nodes.
The Use Case
In my fictional scenario, the business has set an SLA for website performance. To meet the SLA, the web developer has determined that the average concurrent requests received by the web tier should stay below 100 requests per web node. Thus, if the load exceeds 100 requests per node, we should add another web node.
I also want to make sure that the application is cost effective and not tying up resources that could be used by other applications. Here the developer has given guidance that if the web servers are handling fewer than 50 concurrent requests, then the web tier can be scaled in to keep costs down and free up resources.
The developer tells me that the KPI is “Apache Busy Workers”, and I can confidently use this in my automation workflow.
Application Monitoring
I recently published a blog and workflow package for vRealize Orchestrator to automatically install and configure the Telegraf agent on each virtual machine deployed from vRealize Automation. If you have not read that blog yet be sure to check it out using this link as that workflow is important to this solution.
Since vRealize Operations has visibility all the way from the virtual machine to the application services and other components supporting the shopping cart we can use this information to set thresholds for an alert that will trigger a vRealize Orchestrator workflow using the webhook notification feature in vRealize Operations 8.4 and higher.
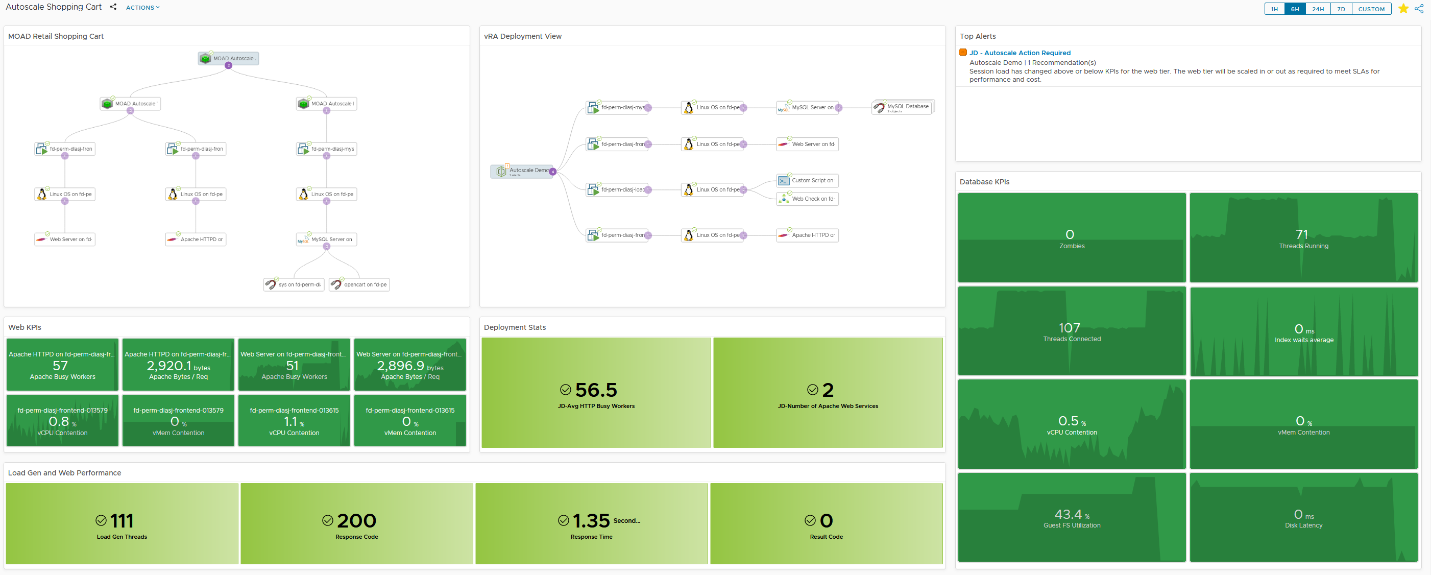
Here is a dashboard I built to show the application, alerts, KPIs and even synthetic monitoring to confirm the performance of the web store.
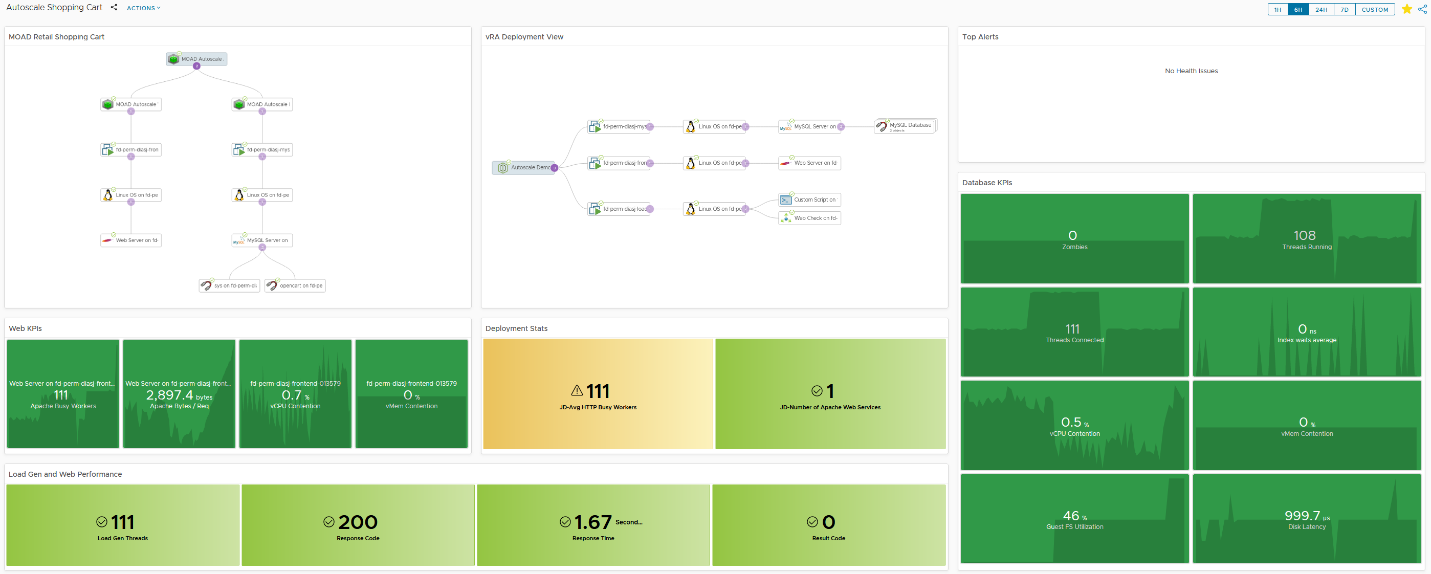
Note that one of the KPIs for the web tier is “Apache Busy Workers” – along with some other KPIs from the hypervisor, guest OS and app services. Let’s take a closer look at some of the dashboard widgets.
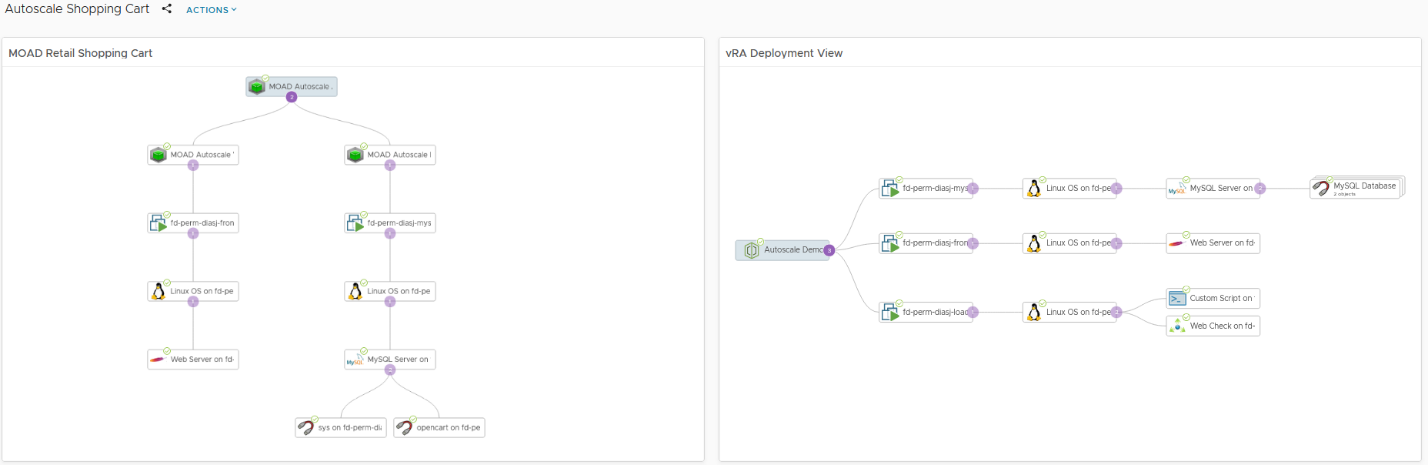
There are two different topologies on the dashboard, representing two different perspectives on the application. On the left is a custom group structure organized by application tier (web and database). This would be the business view I would normally provide for the application owner.
On the right, the topology represents the vRealize Automation deployment. Notice that there is an additional virtual machine in this view, the LoadGen VM. It’s not a part of the application but instead is used in the demo to create traffic on the web tier using Apache jMeter. It is also used to gather some metrics used elsewhere in the dashboard by leveraging the vRealize Operations Application Monitoring HTTP Check and Custom Script monitors. More on those later.

The dashboard also includes KPIs for the web (above) and database tier. Recall that the “Apache Busy Workers” metric (which is collected via Telegraf agent) is what our web dev wants us to watch. There is only a single web server deployed and as you can see, we have a breach of our upper bound SLA of 100 requests. This will trigger the scale out of the application. More on that shortly.

Since the web tier can have up to four web servers, I need a way to average out the busy workers metric across the web tier. For that, I have created two Super Metrics for the vRealize Automation deployment, the result of which you can see in the widget above. As we saw in the Web KPIs widget, I only have the one web server and it has breached the SLA. But I don’t want to trigger the alert on the individual web servers, rather I want to take action on the deployment itself.
So, the “JD-Avg HTTP Busy Workers” is metric that I use to trigger an alert, which will send a webhook notification to vRealize Orchestrator to scale the web tier out by adding another web node.
The Alert and Notification Configuration
Here is the alert definition used for both scale out and scale in.
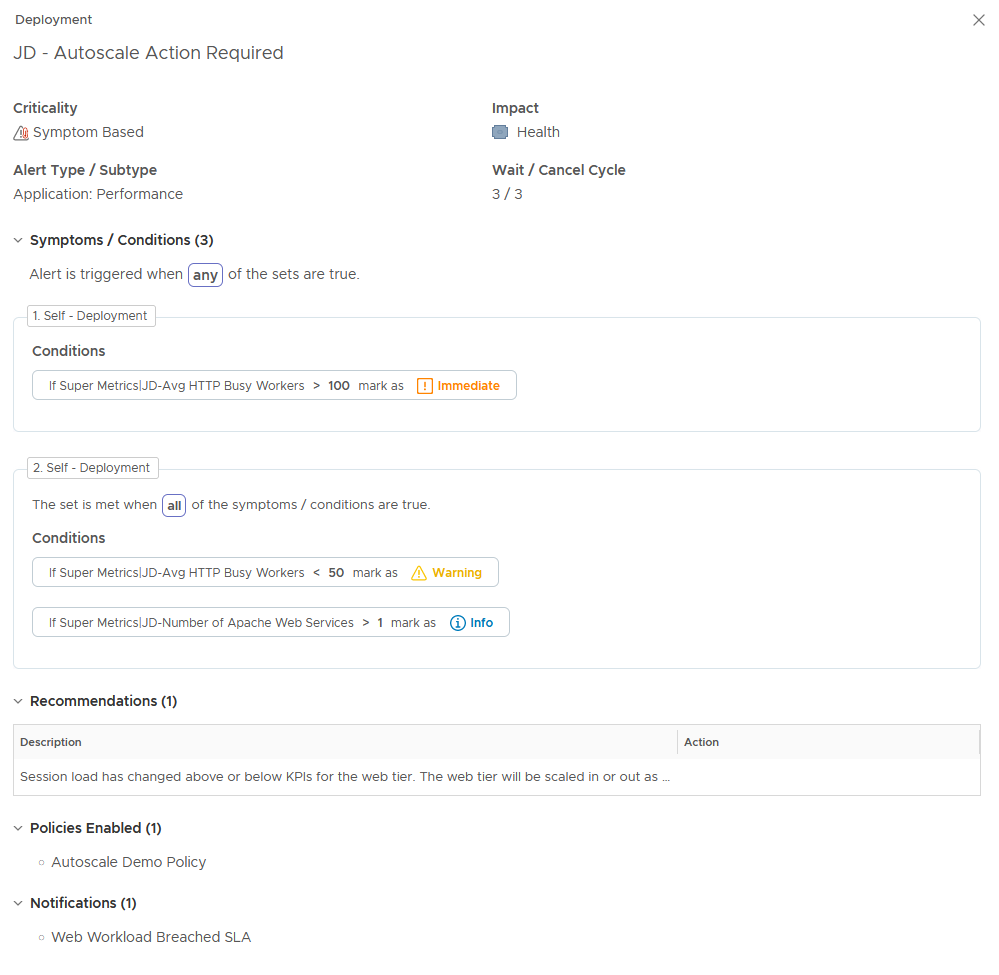
By the way, for this alert definition I am using the new, simplified “alert conditions” feature which was added in vRealize Operations 8.4. It makes it a lot easier to create new alerts if you don’t need the additional capabilities of alert symptoms.
The impacted object for the alert is the vRealize Automation deployment and as you can see the conditions are evaluating the super metrics previously discussed.
In the first condition set, the alert will trigger after 15 minutes of the web tier having more than 100 busy workers on average across the web tier. This will result in a scale out of the web tier.
In the second condition set, the alert will trigger when the web tier has been below the 50 busy worker threshold for 15 minutes. But there is also an additional condition as the web tier must always have at least one node.
Why 15 minutes? It is somewhat arbitrary but for a couple of reasons. First, I didn’t want a temporary spike to trigger the scale out (or a dip to trigger a scale in). Also, it takes some time for the deployment to scale in or out and for vRealize Operations to discover that nodes have been added or removed. The point is that you should evaluate the timing to fit with your use case and requirements.
The alert definition is configured to send a webhook notification to vRealize Orchestrator. The webhook payload includes input parameters required by the vRealize Orchestrator workflow:
- The busy worker average super metric value
- The vRealize Operations resource ID of the deployment
- The alert ID
The Workflow
The workflow shown below decides if a scale in or out is needed and the request is sent to to vRealize Automation to perform the deployment update.
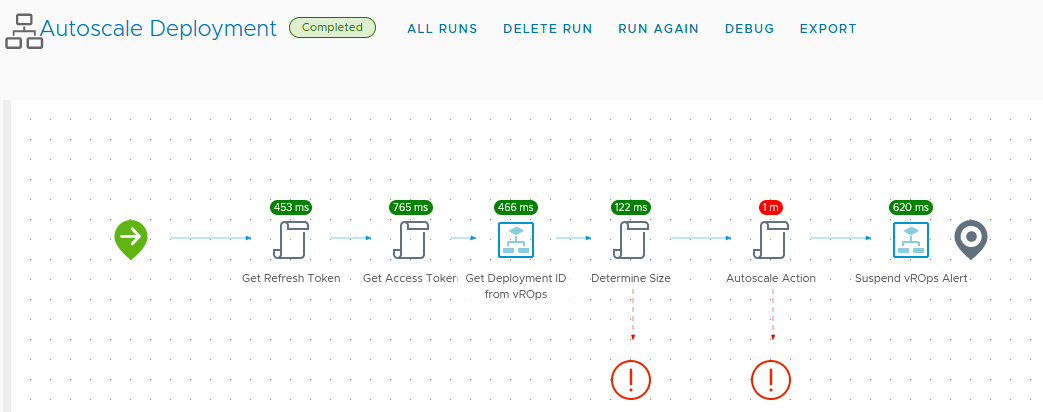
vRealize Operations does not store the vRealize Automation deployment ID as a property, otherwise I could just include it in the webhook notification payload. It is stored as a resource identifier, however, and I can retrieve that via the vRealize Operations API. That is the purpose of the workflow element “Get Deployment ID from vROps” in the schema above.
Once the deployment ID has been retrieved, it is just a matter of determining if the web tier should scale in or out. That is done in the “Determine Size” script element, which uses the busy worker average to set the action input for either small, medium, or large web tier. In cases where the web tier is already at the maximum (or minimum) allowed size, the workflow will throw an exception and exit.
Finally, if the auto scale action is successful, the workflow will suspend the alert in vRealize Operations for 30 minutes to clear it from the dashboard. If the scale out resolves the issue, then the alert will auto-cancel. Otherwise, it will re-appear on the dashboard indicating manual intervention is needed.
Happy Little Web Servers
Within minutes, the web tier will be handling the increased workload. After some time (about 30 minutes or so) the new web server will be discovered by vRealize Operations and the previously mentioned automated Telegraf agent install will configure monitoring of the web service.
Note a few changes on the application dashboard:
- Both topology views show the new web server recently added
- The Web KPIs widget shows metrics for both web servers
- The Deployment Stats widget reflects 2 web servers with an average load of 56.5 busy workers
- The Load Gen and Web Performance widget shows that the traffic is still over 100 concurrent requests
- The alert has shown up, as it was only suspended, but will auto cancel within 15 minutes
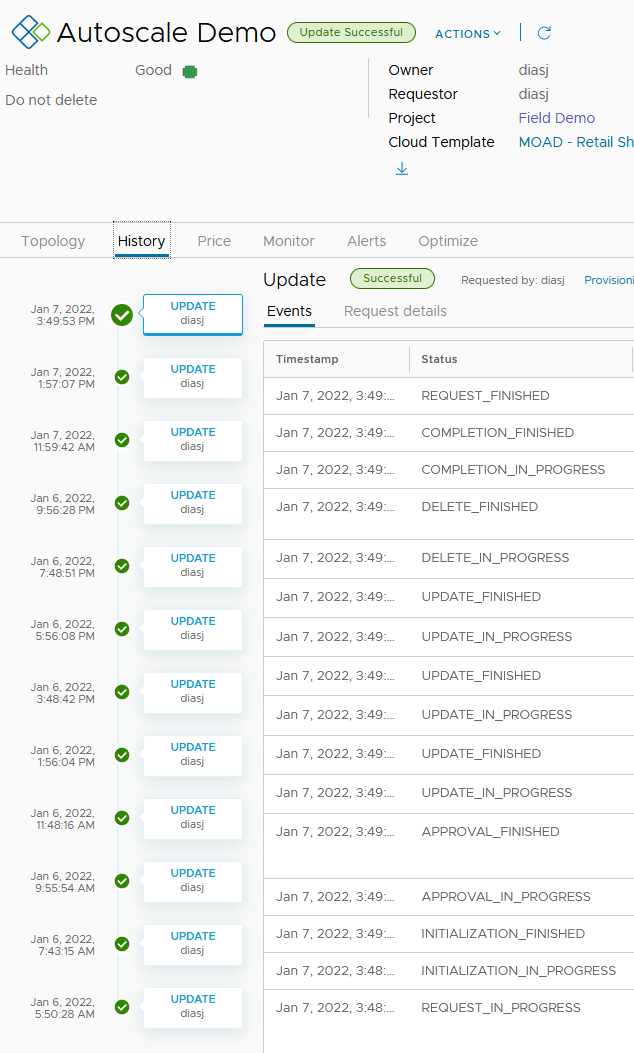
In our lab, I have the load generation set to toggle “low” and “high” traffic loads every couple of hours, and you can see that reflected in vRealize Automation deployment history: